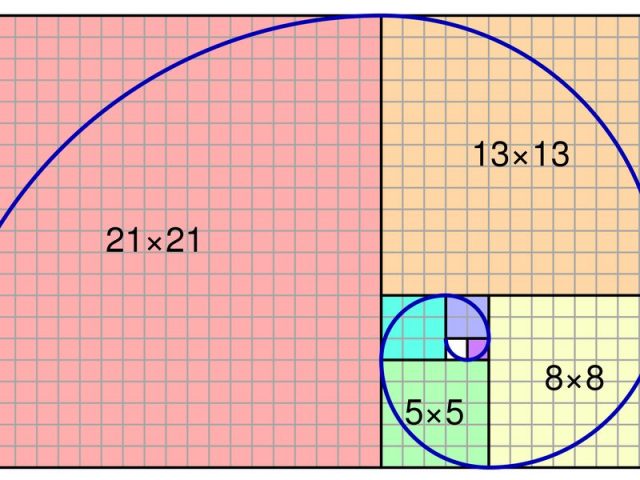
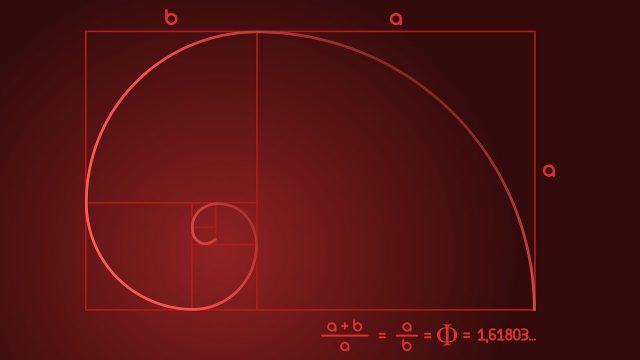
The Fibonacci sequence is a set of numbers starting with zero and one. Each new number in that sequence is the sum of the two numbers that precede it. If you were to plot those numbers on a graph, the end result would be an ever-widening spiral. Contained within this series of numbers is the golden ratio.
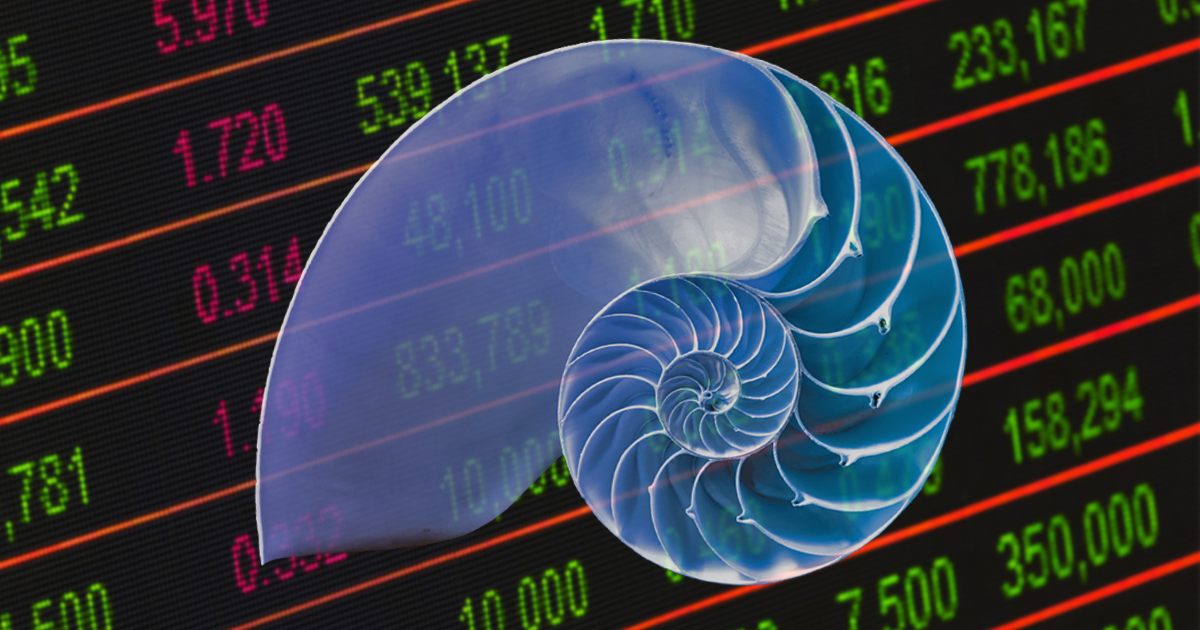
That ratio is a special number. It can be found by dividing a line into two parts in such a way that if you divide the longer part by the shorter part, you get the same number you would end with if you divided the entire line by the longer part. That ratio is more or less found in many places in nature, from the spiral of a nautilus shell to the way the leaves on a plant are distributed to maximize the exposure each one gets to sunlight.

The Fibonacci sequence and golden ratio don’t just show up in nature, they are also present in a number of man-made things, including the stock market, according to an article in Smithsonian magazine. The market has been having a rough time lately, and as it trends sharply down, investors and economists have been wondering if this is the beginning of an extended trend, or if things will stabilize and economies open back up for regular business.

One tool that analysts are using to try to figure that out is something called ‘Fibonacci retracement,’ which is named for the Fibonacci sequence. Retracement ratios are used to try to predict price reversals in the stock market, according to the investment blog Bigger Pockets. The ratios are derived from the distance between Fibonacci numbers.

The way it works is that traders look for two extreme points in a stock price’s peak and trough, and divide the vertical distance between the points by three Fibonacci ratios, often 26.3%, 38.2%, and 61.8%. They can then make horizontal lines at each of those points and use them to find potential levels of support and resistance, and, by extension, to identify the points at which the stock’s price might reverse.

The number series that holds the golden ratio got its name from a Medieval Mathematician from Italy, Leonardo of Pisa, whose nickname was Fibonacci. History doesn’t really know very much about his life, except for the fact that he was the son of customs official who traveled to North Africa with his family. While he was there, he had the opportunity to study Arabic mathematics, and came home full of mathematical notions he later started spreading among European mathematicians. In so doing, he started a resurgence of interest in the field across the continent, after mathematics had been stagnating since the Dark Ages.
He is best known for two things, his book ‘Liber Abaci,’ or Book of Calculation, promoting the use of the Arabic numbering system, and for introducing Europe to a set of numbers which were named in his honor, the Fibonacci sequence. Whether or not the Fibonacci sequence and the retracement ratios are actually effective tools for analyzing stock market trends is a matter of some debate.
Katie Stockton, one of the owners and analysts at Fairhead Strategies LLC in Connecticut has been using them to try to predict whether the market will continue its current downward trend, but has not yet gathered enough information to suggest whether the trend is likely to continue. A mathematician at UC Berkley, Ken Ribet, is somewhat skeptical, however, thinking that using the sequence can be a self-fulfilling prophecy. Even if the sequence doesn’t play a role in understanding market forces on its own, it can be made to have a role because analysts believe it does. If the sequence causes a lot of investors to start buying, the market will start trending upward as a result. The inverse would also be true.
Related Article: How the Invention of Zero Changed History
Stockton acknowledged that Ribet may have a point, citing the way gold was moving in the market last year when its price would go above a specific Fibonacci level. In the end, it’s hard to say with absolute authority whether or not the Fibonacci sequence plays out in broad market forces, or whether it only has a magical effect, but it remains one of the many tools that technical analysts and individual investors use in trying to make sense of a very uncertain market situation.
